← All work

Financial Risk and Assurance Pipeline

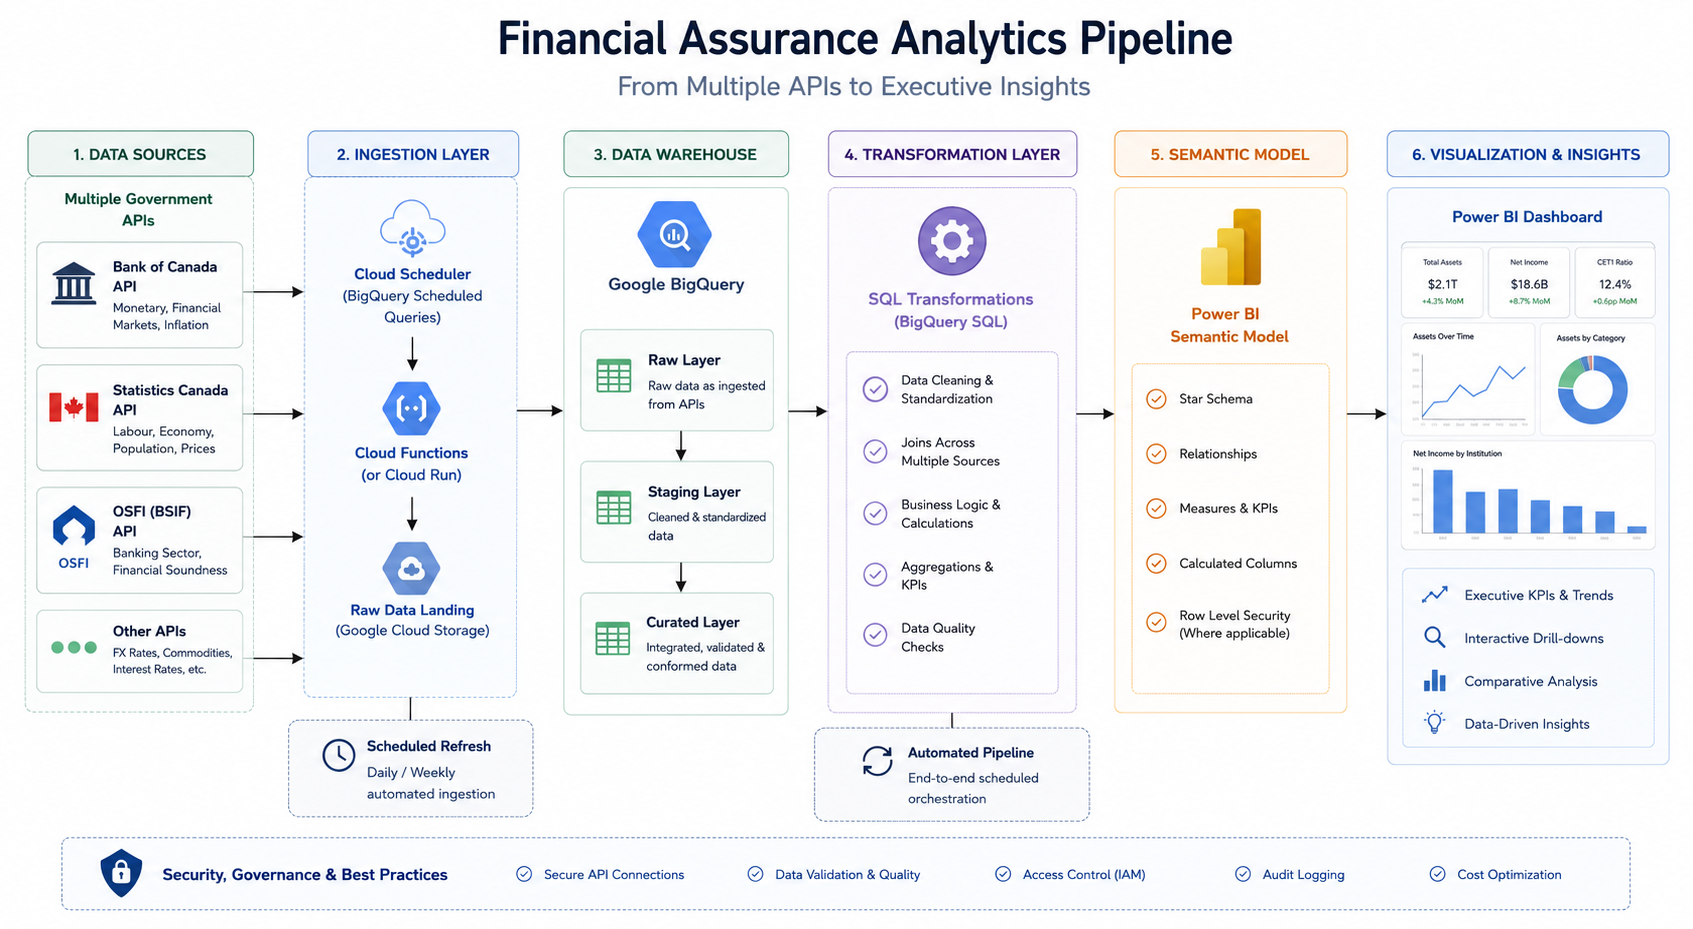
Bank of Canada, Statistics Canada and OSFI data in BigQuery on a quarterly schedule, ranking institutions by assurance risk.

BigQuery · Power BI
Financial Risk and Assurance Pipeline
Role
Solo build: pipeline, model and report
Stack
Google Cloud (Scheduler, Functions, Storage), BigQuery SQL, Power BI, DAX
Data
Bank of Canada Valet API, Statistics Canada API, OSFI data via open.canada.ca
Refresh
Quarterly, Cloud Scheduler
Context

Why it mattered

Supervisors need an early read on which institutions are drifting toward trouble. The signals are public but scattered: balance sheets and credit losses from OSFI, rates from the Bank of Canada, and household debt indicators from Statistics Canada.

This project pulls all three into Google BigQuery on a quarterly schedule, models them as a star schema, and serves a Power BI dashboard that ranks institutions by an assurance risk score and explains what changed.

The question
Which financial institutions should be prioritized for assurance review, based on emerging financial risk indicators?
  • Is credit risk rising across the system?
  • How do impaired loans move against the policy rate?
  • Which institutions score highest on risk?
Approach

How I solved it

01 · Ingest

Three public APIs.

Cloud Functions call the Bank of Canada Valet API, the Statistics Canada API and the open.canada.ca data API, and land raw files in Cloud Storage.

Bank of Canada Valet APIStatistics Canada APIOSFI via open.canada.caCloud Storageraw landing
02 · Layer

Raw, staging, analytics.

BigQuery datasets mirror the medallion idea: raw tables per source, a staging layer that cleans and standardises, and an analytics layer for reporting.

Rawboc_raw, osfi_raw,statscan_rawStagingcleaned andstandardisedAnalyticsconformedstar schemaas ingestedready for Power BI
03 · Model

Five facts, three dimensions.

Balance sheet, income statement, credit losses, household stress and macro conditions, all keyed to date, institution and metric.

dim_datedim_institutiondim_metricfact tablesbalance sheet, income,credit losses, stress, macro
04 · Schedule

Quarterly, without anyone pressing run.

Cloud Scheduler triggers the refresh on the 20th of January, April, July and October at 6:00, Edmonton time.

CLOUD SCHEDULERquarterlyCloudFunctionsrawlandingBigQuerySQLanalyticstablesCRON0 6 20 1,4,7,10 *quarterly-financial-assurance-refresh
05 · Serve

Rank, then explain.

KPIs, an institution risk table and executive insights that state what moved since the last reporting period.

FINANCIAL RISK AND ASSURANCE INTELLIGENCEINSTITUTIONS6AVG RISK SCORE51.7%IMPAIRED LOANS0.54%POLICY RATE2.25%EXECUTIVE INSIGHTAsset quality is deteriorating.The average impaired loan ratiorose 7.80% from the previousreporting period.
Outcome

What it delivers

3 APIsBank of Canada, Statistics Canada and OSFI in one warehouse
8 tablesfive facts and three dimensions in the analytics layer
QuarterlyCloud Scheduler refresh, no manual pulls
Rankedinstitutions ordered by an assurance risk score
Demo

See it for yourself

A short screen recording of the finished work. It only plays when you press the button.

Financial Risk and Assurance Pipeline preview