Databricks · Power BI
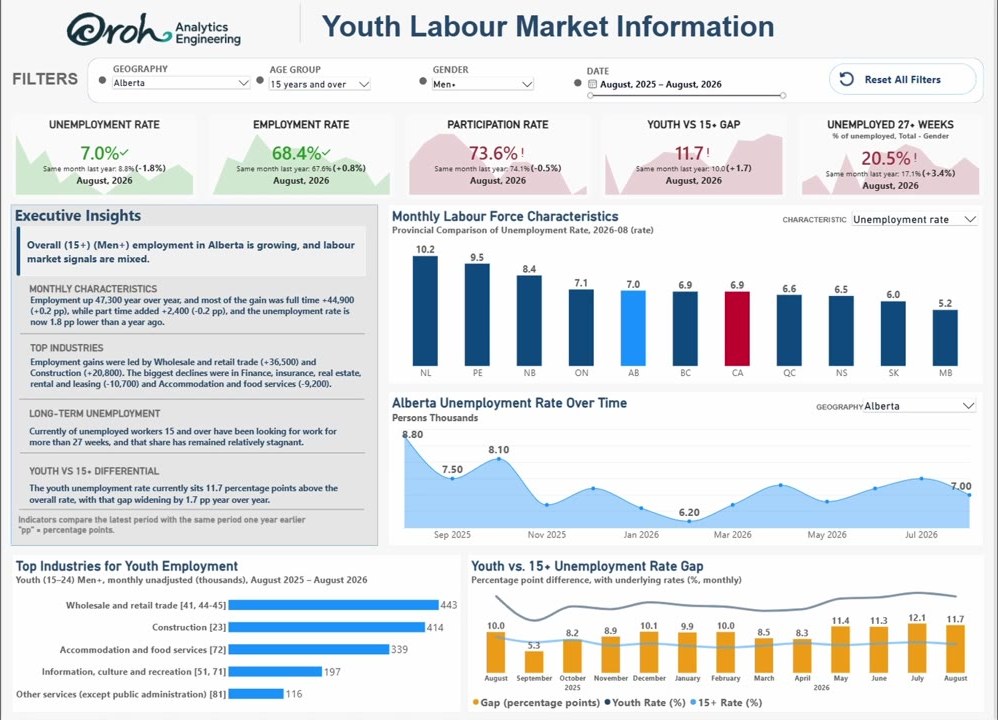
Youth Labour Market Information Dashboard
An automated Databricks pipeline, from REST APIs to a governed star schema, behind a Power BI dashboard that explains each month in plain language.
I build Databricks pipelines, model the data in SQL and serve it in Power BI. I do this every day as a data analyst working with economic data.
Pick any project to see the context, the question it answered and how I built it.
An automated Databricks pipeline, from REST APIs to a governed star schema, behind a Power BI dashboard that explains each month in plain language.
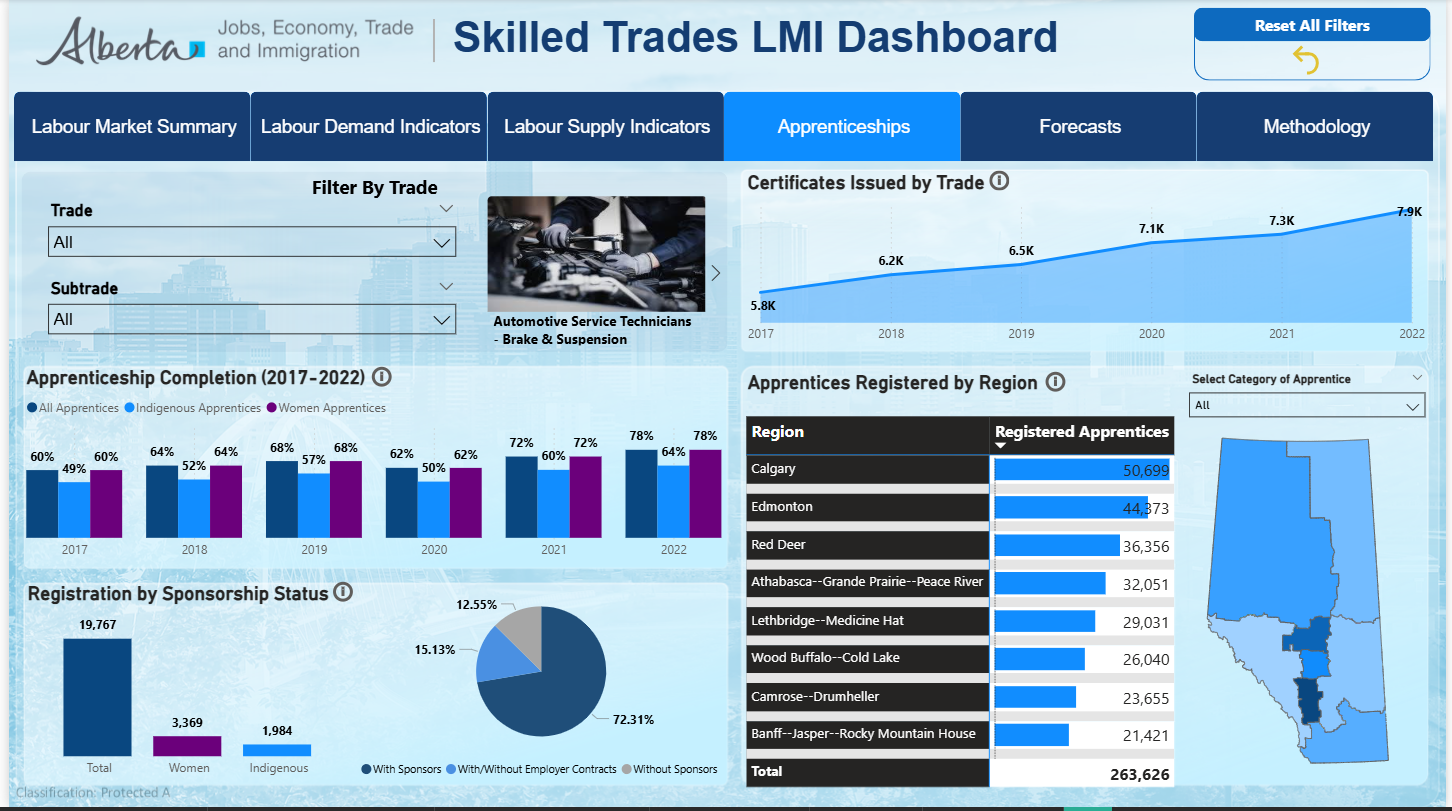
Demand, supply, apprenticeships and a ten-year outlook for Alberta's 59 designated trades, mapped by economic region.

How much Alberta's labour force participation depends on newcomers, estimated in R with counterfactuals, a decomposition and a structural break test.
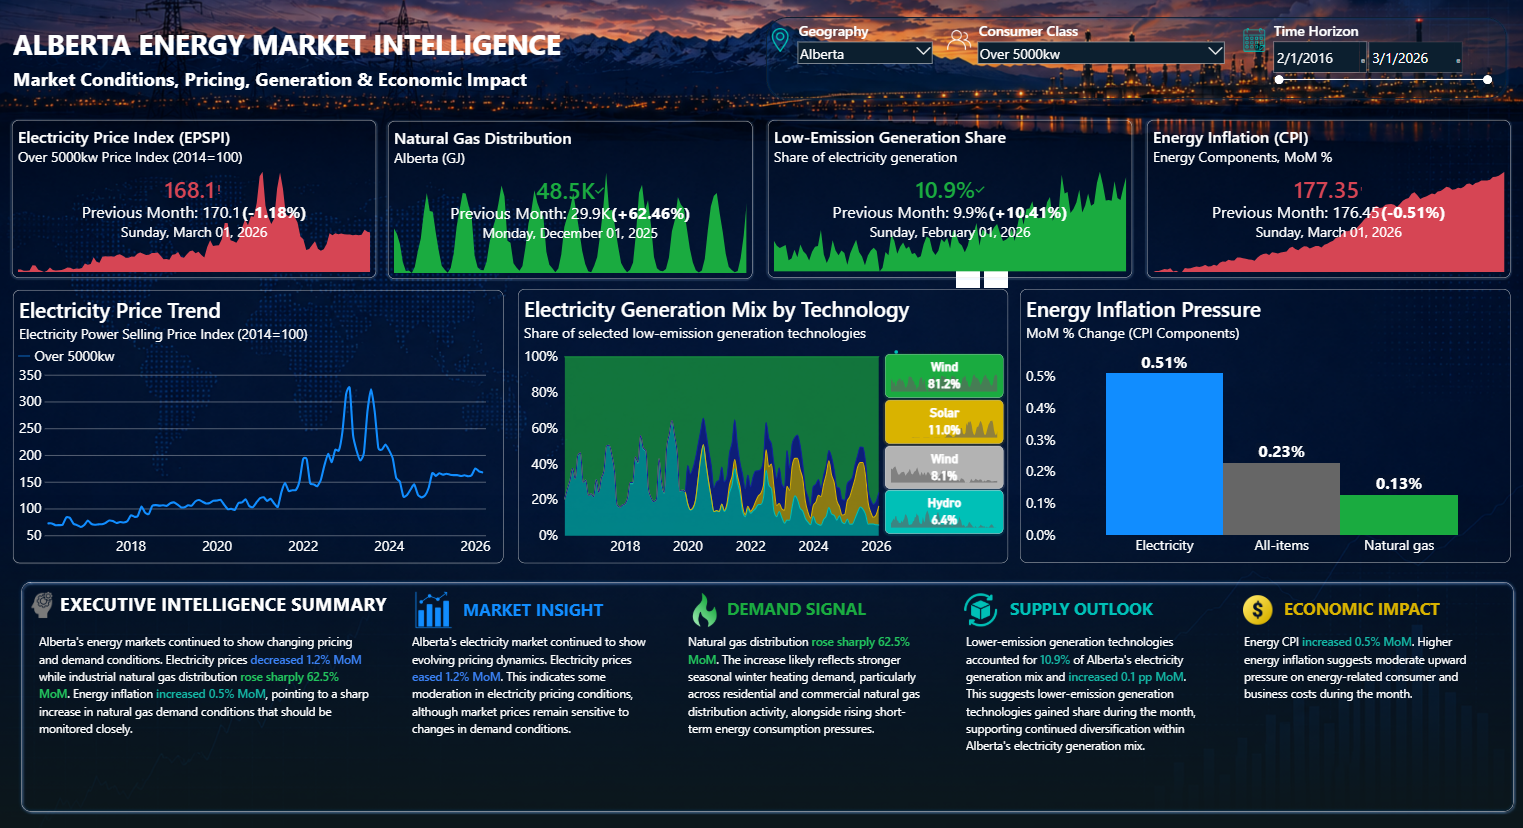
Four Statistics Canada energy indicators in one Power BI model, with a monthly executive summary written automatically for each province.
 Hiring Demand BulletinMonthly report
 Industry Profiles AutomationAutomation · R
 Canadian Crude Prices and Trade VulnerabilityR · Scenario analysis
 Pipeline Capacity and Royalty RevenueR · Energy infrastructure
 Canada's Electricity Mix and EmissionsR · Energy transition
 Housing Shifts in Post-COVID EdmontonResearch · 1st place
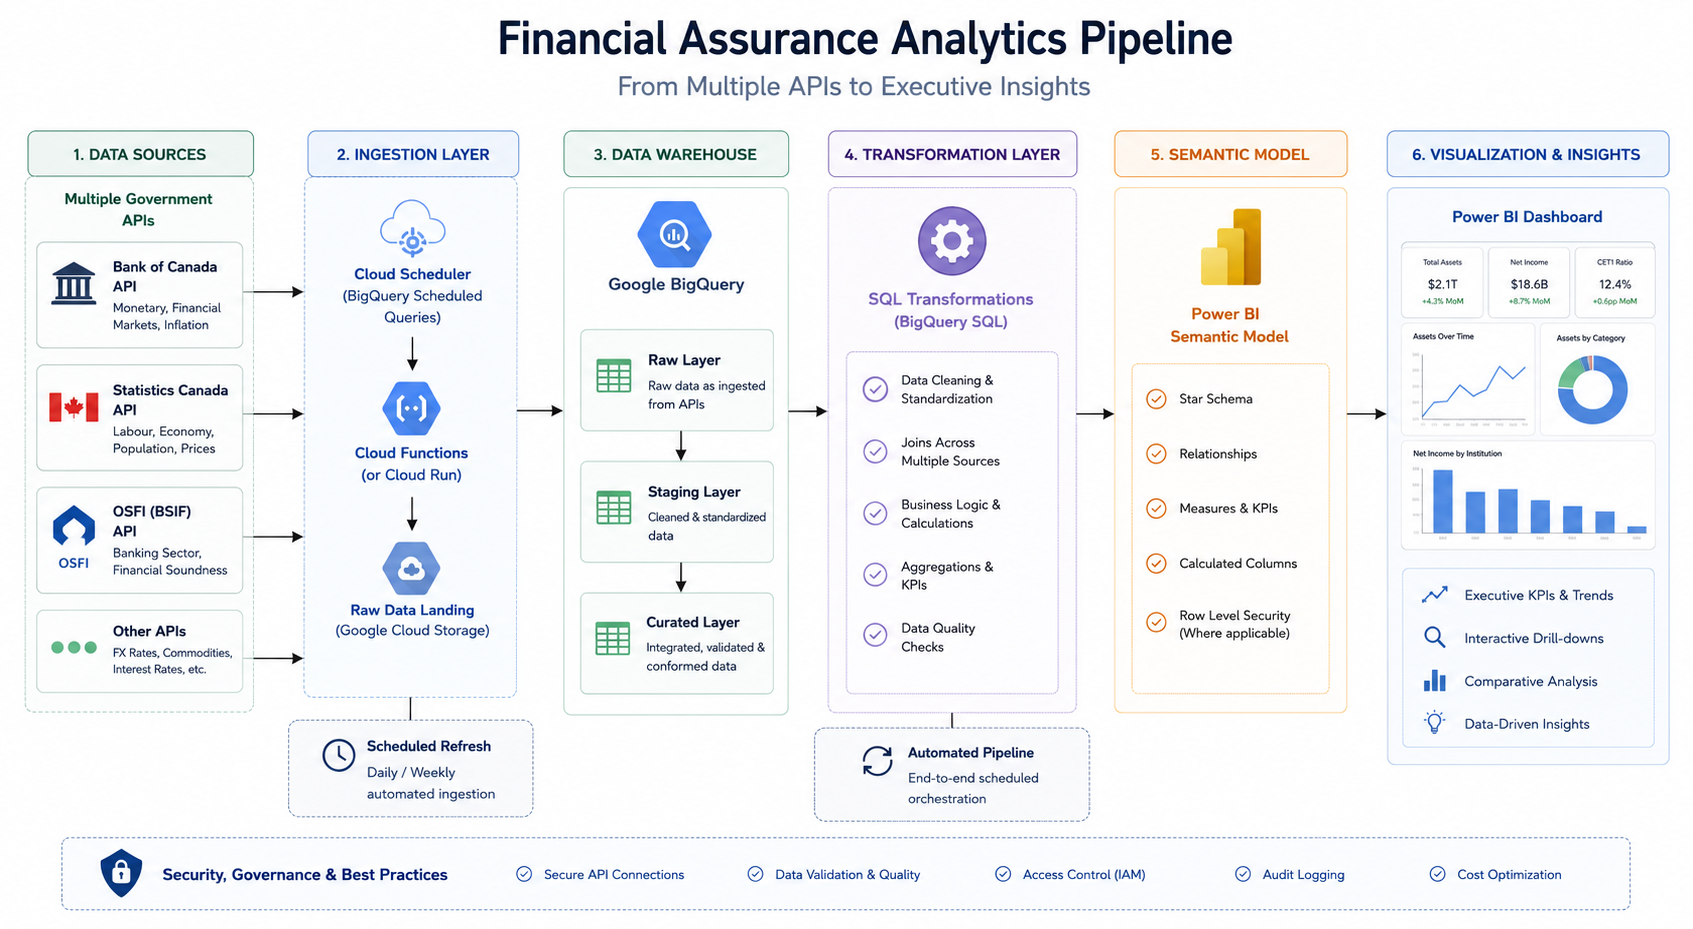 Financial Risk and Assurance PipelineBigQuery · Power BI
LILFS Indigenous Data PipelineAutomation · R
 Greenhouse Gas Facility Data PullPython · Web scraping
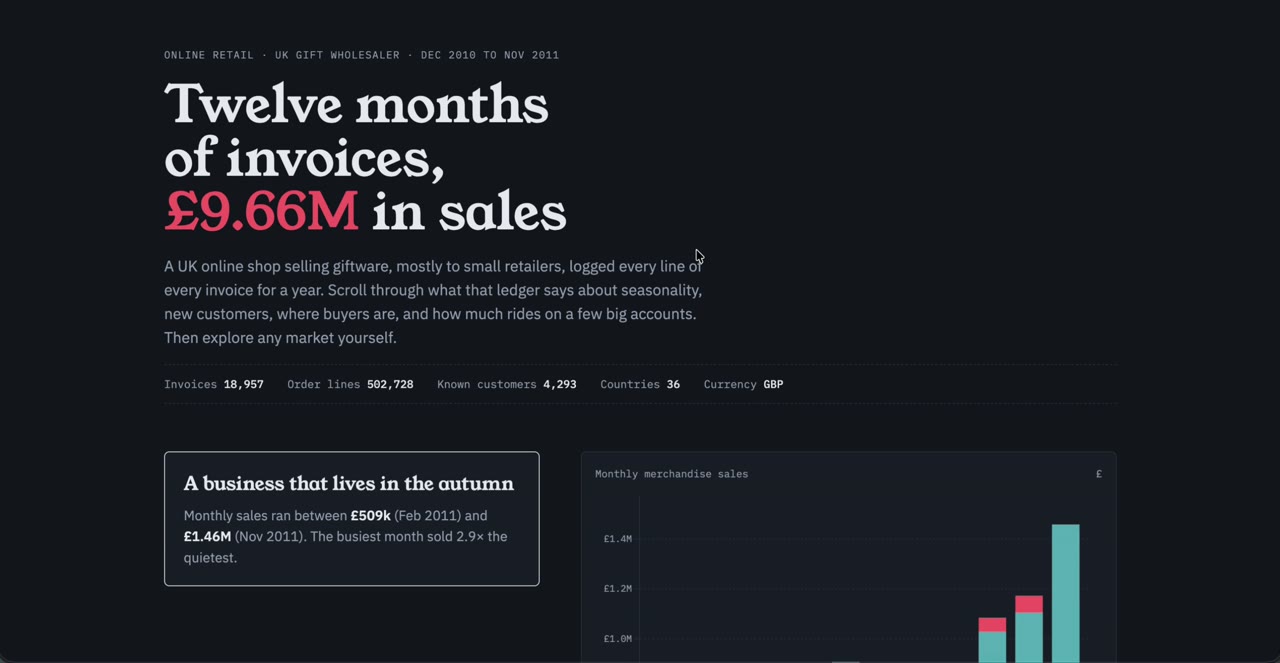 Gift Trade LedgerD3.js · Scroll storytelling
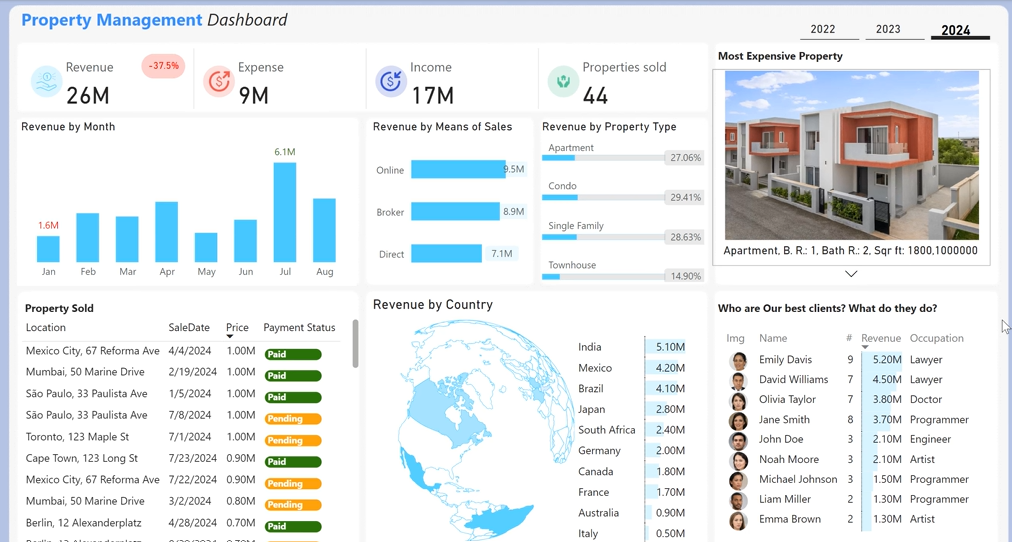 Property Management DashboardPower BI · Practice project
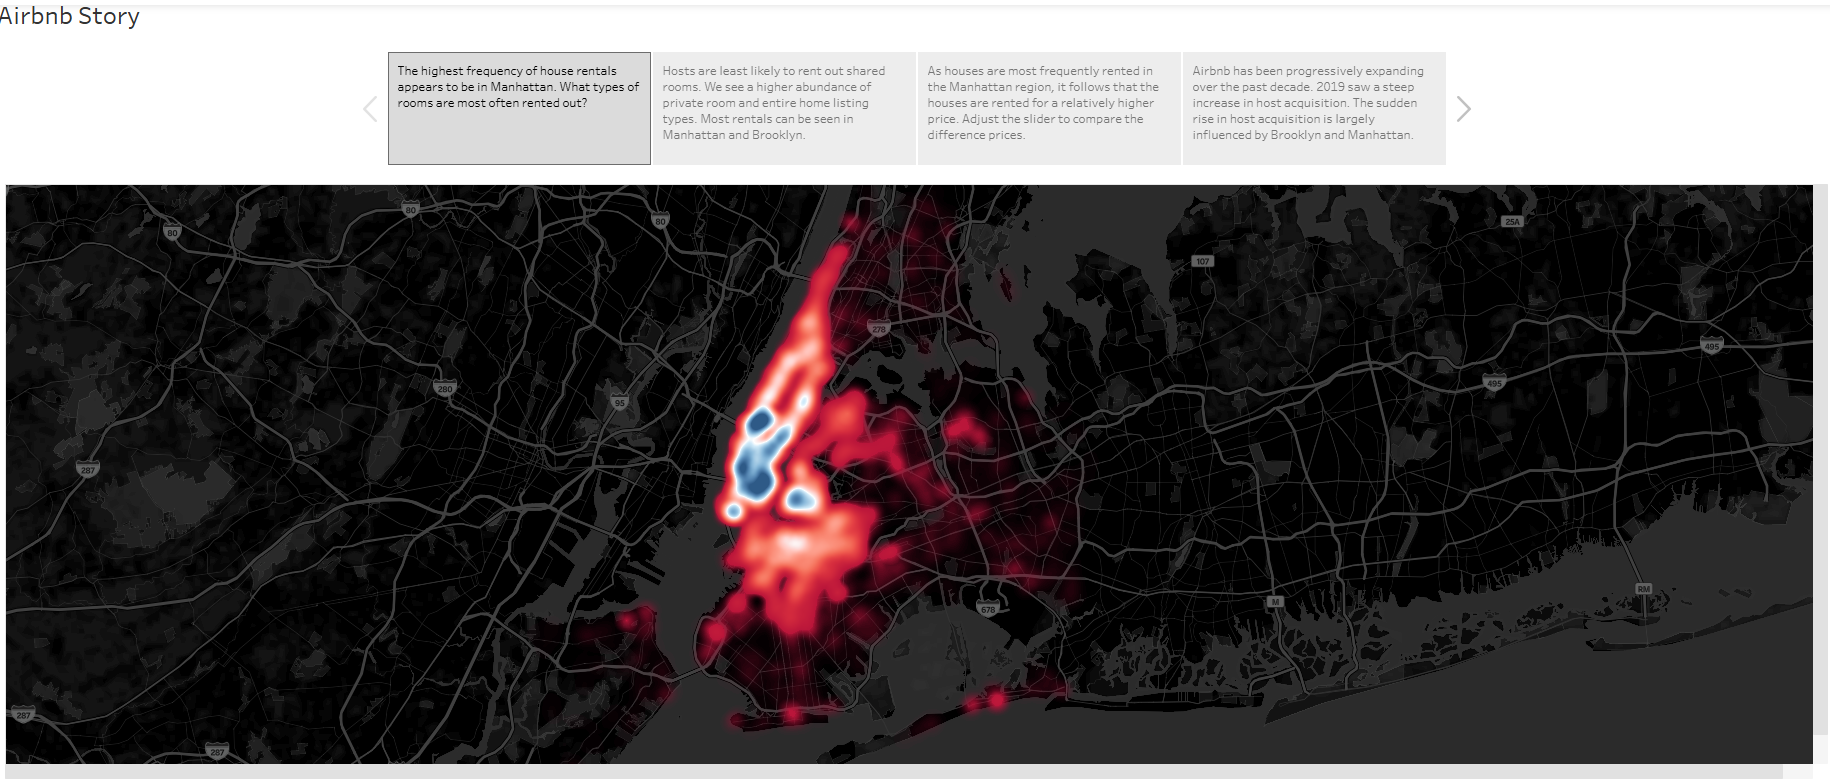 Airbnb Market StoryTableau · Practice project