← All work

Housing Shifts in Post-COVID Edmonton

A first-place team paper on whether COVID-19 permanently changed where Edmontonians live. I led the descriptive analysis.

Research · 1st place
Housing Shifts in Post-COVID Edmonton
Role
Team of three; led Section 5, the descriptive analysis
Stack
R, geospatial analysis, Bayesian VAR
Data
City of Edmonton property assessments 2012 to 2024, a confidential residential dataset, building permits
Result
1st place
Context

Why it mattered

During the pandemic, households in many large cities moved away from downtown, a pattern researchers call the donut effect. Most of that evidence comes from big, transit-rich cities.

Edmonton is different: mid-sized, car-oriented, fast-growing, and an early adopter of zoning reform. In a competition for Masters-level and above teams using City of Edmonton data, our three-person paper took first place. I led Section 5, the descriptive analysis that framed the main models.

The question
Did COVID-19 permanently change where and how people in Edmonton live?
  • Did demand shift away from the urban core?
  • Did preferences move from high-density to low-density housing?
  • Are post-2020 changes bigger than pre-pandemic trends predict?
Approach

How I solved it

01 · Data

Five million property records.

Parcel-level assessments from the City of Edmonton Open Data Portal, a confidential residential dataset with detailed land use, building permits, and context from COVID-19 counts, interest rates and CMHC.

Property assessments 2012 to 2024Confidential residential dataBuilding permits since 2009COVID, rates and CMHCEdmonton panel5M+ propertyrecords
02 · Describe

My section: describe before modelling.

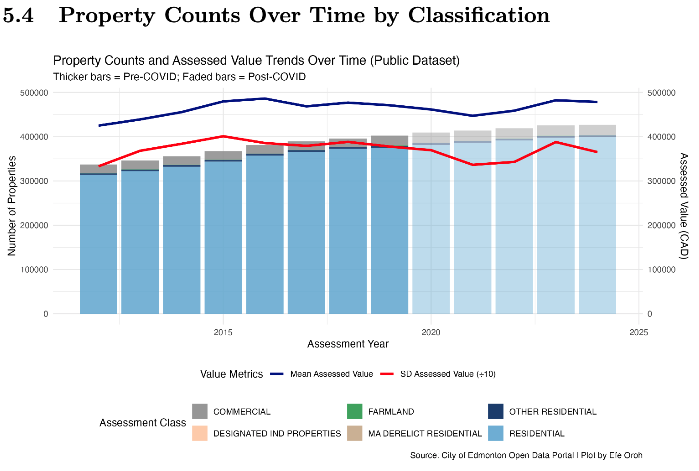
Distributions, boxplots, counts by assessment class and neighbourhood maps showed a V-shaped recovery: values dipped through the pandemic and returned near their 2016 peak by 2023 to 2024.

$420K$460K$500K2012201620202024COVIDmean valueMean assessed value, approximate
03 · Distance

Measure the shift from the core.

Every property is placed by its distance from downtown, so changes in demand can be compared ring by ring.

Downtown coreInner neighbourhoodsSuburbsEdge of the cityDemand drifted outward after 2020.
04 · Density

High density against low density.

Permits and assessments by building type show housing preference moving toward low-density, peripheral homes.

Permitsby buildingtypeHigh densityapartments,condosLow densitysingle-family,duplexShifttoward lowdensity
05 · Counterfactual

What if COVID had not happened?

The team's Bayesian VAR forecast the post-2020 path from pre-pandemic data. Actual values moved significantly away from that forecast, pointing to a lasting structural shift.

201620202024pandemicactualBVAR forecastSchematic.
Outcome

What it delivers

1st placein a competition for Masters-level and above teams
5M+property records described in my section
V-shapedvalues dipped in the pandemic and recovered by 2023 to 2024
Lastingpost-2020 shifts differ significantly from pre-pandemic trends
Demo

See it for yourself

The full report, with every chart and the written analysis.

Housing Shifts in Post-COVID Edmonton preview