← All work

Greenhouse Gas Facility Data Pull

A Selenium scraper that collects every facility's emissions, owner and location for a Power BI emissions map.

Python · Web scraping
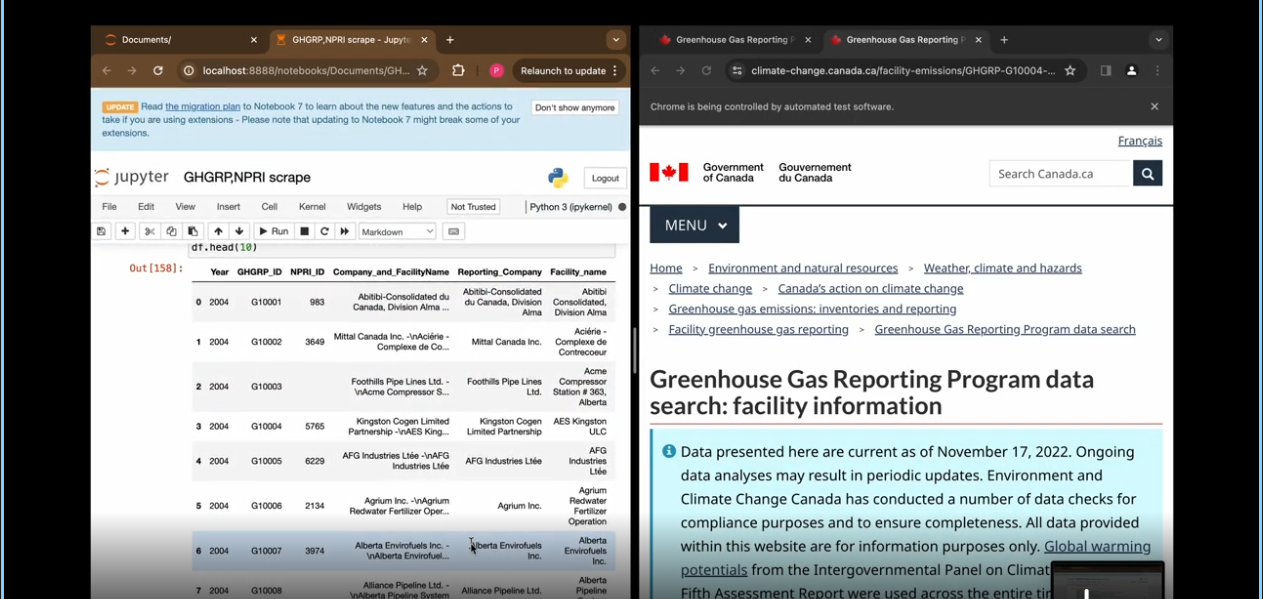
Greenhouse Gas Facility Data Pull
Role
Built the scraper
Stack
Python, Selenium, pandas, Jupyter, Power BI
Data
Environment and Climate Change Canada, Greenhouse Gas Reporting Program
Scale
1M+ rows
Context

Why it mattered

Environment and Climate Change Canada publishes facility-level greenhouse gas emissions through a search page. Results come ten rows at a time, and details like the parent company, ownership share and coordinates sit on a separate page for each facility.

That data fed a Power BI dashboard mapping emission sources, which needed refreshing every reporting year. I wrote a Python scraper that collects all of it in one run.

The question
How can facility emissions, owners and locations be refreshed every reporting cycle without copying them by hand?
  • How do we page through every result for every year?
  • How do we capture fields that only exist on detail pages?
Approach

How I solved it

01 · Target

Two kinds of page.

The search results list emissions by gas; each facility's own page holds the owner, address and coordinates.

GHGRP facility searchFacility detail pagesNPRI identifiersPython scraperSelenium + pandas
02 · Scrape

Every page, every field.

For 2021 alone, the search returns 1,731 facility reports across 174 pages. The scraper walks every page and opens every facility.

climate-change.canada.ca1,731 reports for 2021next page × 174DATAFRAMEYear, GHGRP ID, NPRI IDCompany and facilityNAICS, city, provinceCO2, CH4, N2O (t CO2e)HFCs, PFCs, SF6, totalParent company, ownership %Address, latitude, longitude
03 · Loop

Year by year.

For each reporting year: search, paginate, open each facility in a new tab, read its fields, close it, append the row.

Choose yearsearch formPaginate10 rows a pageOpen facilitydetail tabAppendto DataFrame
04 · Serve

Into the emissions map.

The cleaned table loads into Power BI, where latitude and longitude place each facility on the map.

DataFrameclean exportPower BIimportfacility modelEmissions map
Outcome

What it delivers

1M+rows collected and cleaned
1,731facility reports for 2021 alone, each with its own page
1 runper reporting year instead of manual copying
3 yearsof use for the team's emissions mapping dashboard
Demo

See it for yourself

A short screen recording of the finished work. It only plays when you press the button.

Greenhouse Gas Facility Data Pull preview