← All work
Gift Trade Ledger
A scroll-driven data story and market explorer built on a UK retailer's full year of invoices.
D3.js · Scroll storytelling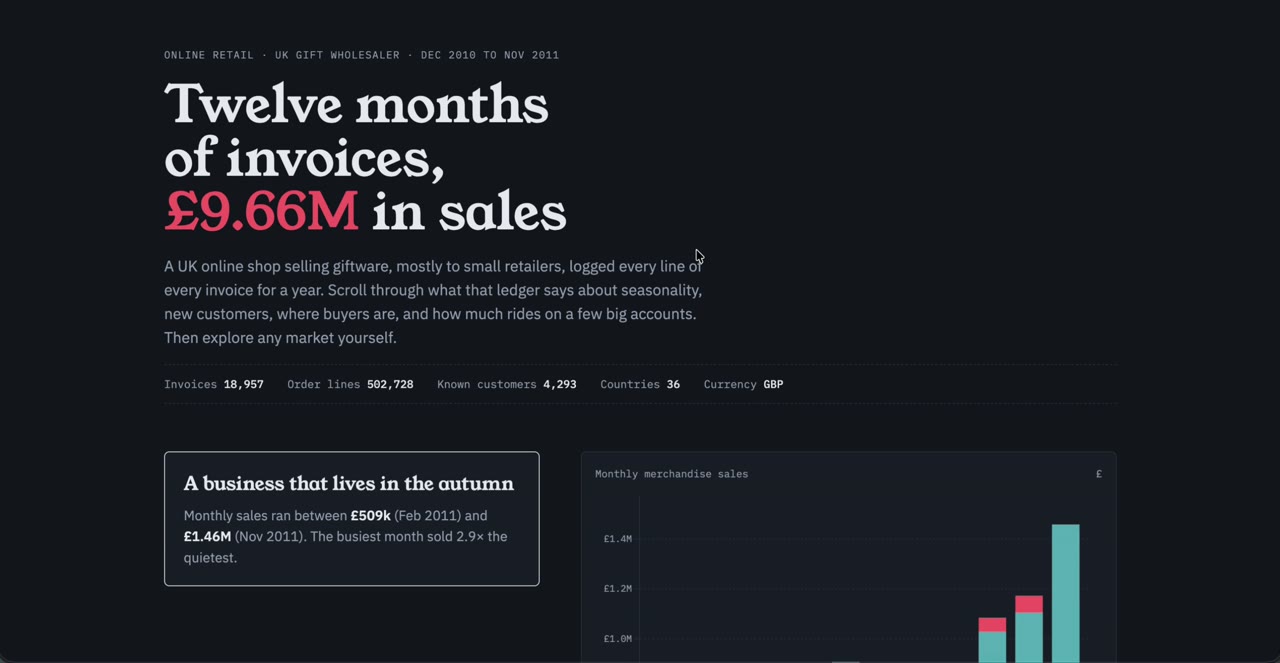
Context
Why it mattered
A UK online gift wholesaler logged every line of every invoice for a year: 541,909 rows from the UCI Online Retail dataset. Transaction logs like this hold a business's real story, but almost nobody reads them.
I built a scroll-driven story on top of it, with animated charts and a world map, followed by an explorer that rewrites its KPIs, charts and executive brief for any market you pick.
The question
What does a year of invoices say about seasonality, customers, markets and concentration risk, and can anyone explore it without help?
- When does the business make its money?
- Is growth coming from new or returning customers?
- How much revenue rides on a few accounts?
Outcome
What it delivers
£9.66Mmerchandise sales across 12 months
37%of sales landed September to November
60%of revenue from the top 10% of customers
36markets to explore, each with its own brief
Demo
See it for yourself
The live page runs in your browser, and a short recording walks through it.