← All work

Airbnb Market Story

A Tableau story on where New York City Airbnb rentals cluster, what rents most, and how the host base grew.

Tableau · Practice project
Airbnb Market Story
Role
Practice project
Stack
Tableau
Data
Airbnb listings, New York City
Context

Why it mattered

A practice Tableau story built on New York City Airbnb listings data, written as a sequence of story points that each answer one question.

The question
Where are Airbnb rentals concentrated, what kinds of rooms rent most, how does price vary by area, and how fast is the host base growing?
Approach

How I solved it

01 · Story

Four story points.

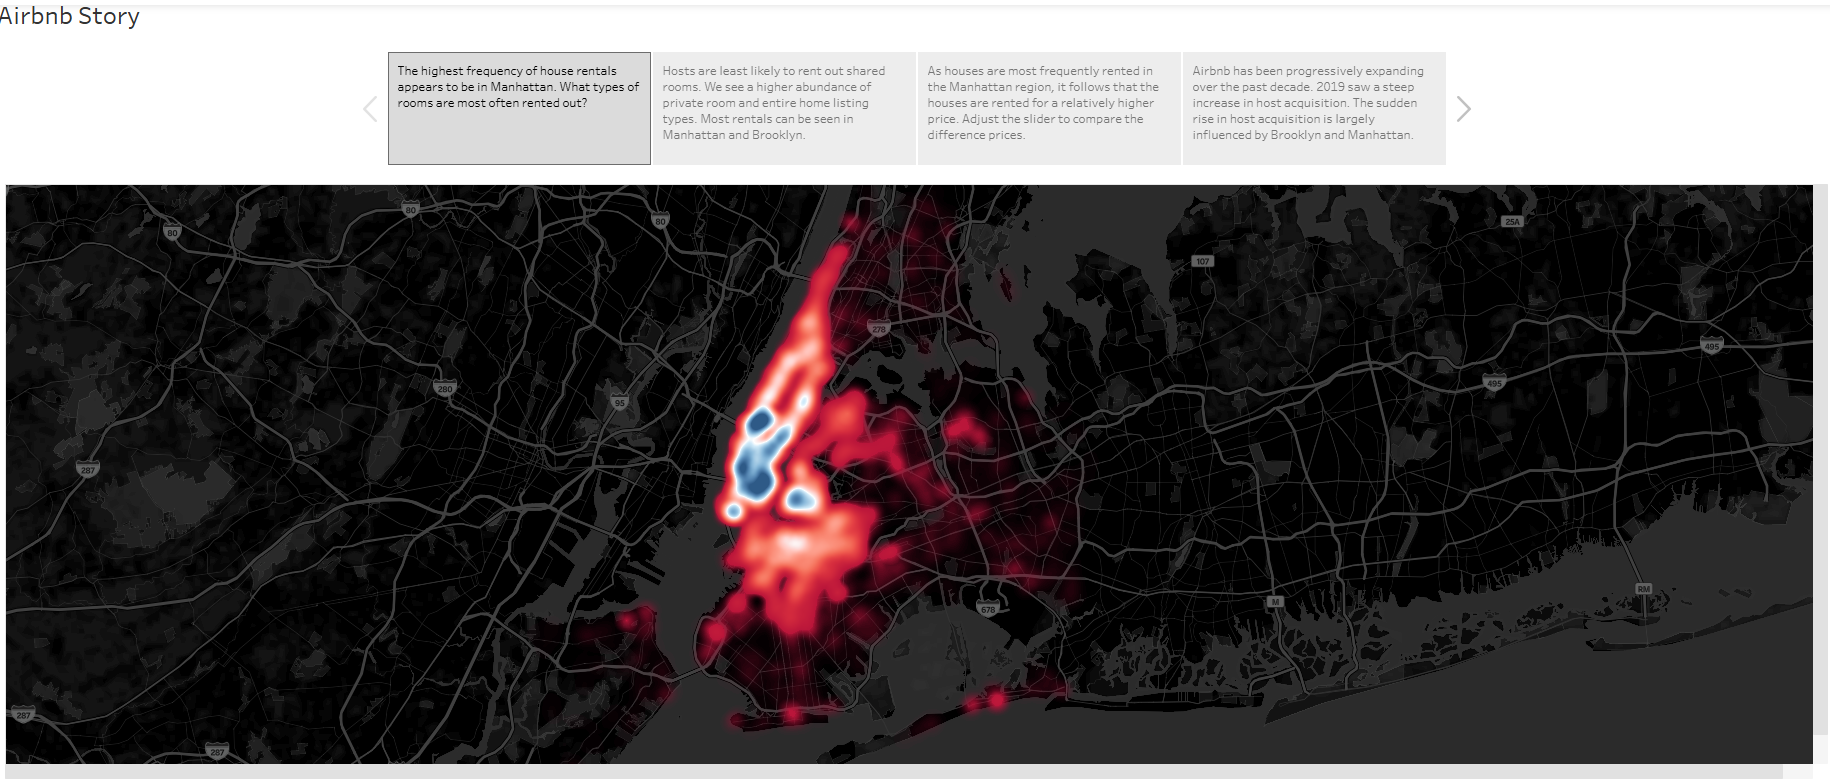
A density map, room types, price by area with a slider, and host growth over time.

Densitylistings byareaRoom typesentire,private, sharedPriceby area, sliderGrowthnew hosts byyear
02 · Findings

What the story shows.

Manhattan has the densest rentals and higher prices; shared rooms are the least offered; host sign-ups rose steeply in 2019, led by Brooklyn and Manhattan.

DENSESTManhattanLEAST OFFEREDshared roomsSTEEPEST GROWTH2019RULESone questionper story pointGENERATED TEXTMost rentals sit inManhattan andBrooklyn, mostlyentire homes andprivate rooms, and thehost base grew fastestin 2019.
Outcome

What it delivers

Manhattandensest rentals and higher prices
Shared roomsleast likely to be offered
2019steepest rise in new hosts
Demo

See it for yourself

The interactive version, hosted online.

Airbnb Market Story preview