← All work
Property Management Dashboard
A single-page Power BI view of property sales, channels, clients and countries from a practice dataset.
Power BI · Practice project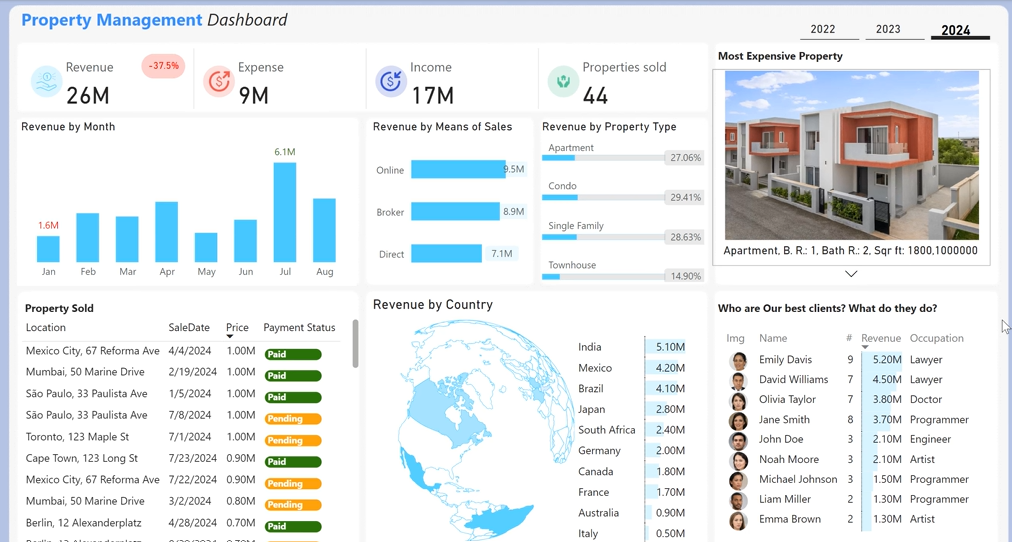
Context
Why it mattered
A practice project from my analytics training: a sample dataset of property sales from 2022 to 2024, with buyers, sale channels, property types and payment status.
The aim was a clean, one-page executive view that answers the obvious questions in a few seconds.
The question
How is revenue tracking by year, channel, property type and country, and who are the best clients?
Outcome
What it delivers
3 yearstoggle between 2022, 2023 and 2024
1 pagerevenue, channels, types, countries and clients
Cross-filteringclick any country or client to filter everything
Demo
See it for yourself
A short screen recording of the finished work. It only plays when you press the button.