01 · Ingest
Monthly survey tables land through the API.
A bronze_ingestion notebook calls the Statistics Canada REST API for each Labour Force Survey table and writes the responses to Delta tables exactly as delivered.
An automated Databricks pipeline, from REST APIs to a governed star schema, behind a Power BI dashboard that explains each month in plain language.
Databricks · Power BI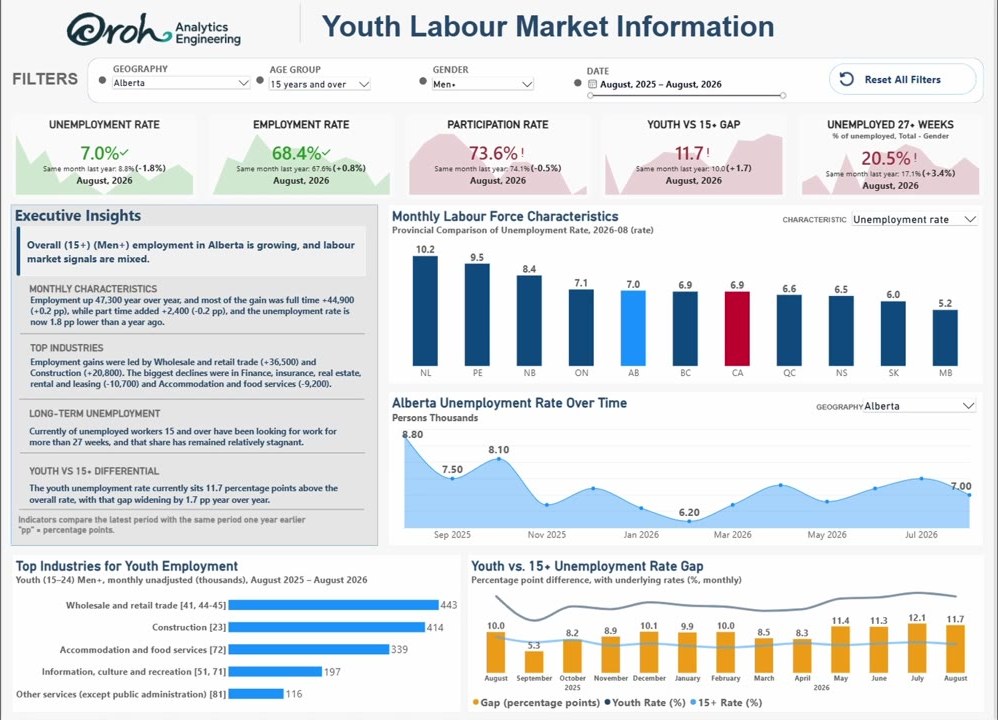
Young people aged 15 to 24 are usually the first to feel a cooling job market. In August 2026, Alberta's youth unemployment rate sat 8.5 percentage points above the rate for everyone 15 and over, and 20.5% of unemployed Albertans had been looking for work for more than 27 weeks, up from 17.1% a year earlier.
The dashboard that tracked this ran on local Excel files. Every month, when Statistics Canada released the Labour Force Survey, the tables were downloaded, cleaned and pasted in by hand. That took roughly two days, left no record of who changed what, and meant there was never one trusted version of the data.
I rebuilt it end to end on Databricks: governed tables in Unity Catalog, a medallion pipeline that runs on a schedule, a star schema built for Power BI, and executive insights that rewrite themselves for whatever the reader filters.
How is the youth labour market moving each month, how does it compare with the overall labour market and other provinces, and can the answer refresh itself the day new data lands?
A short screen recording of the finished work. It only plays when you press the button.