← All work

Canadian Crude Prices and Trade Vulnerability

What net-zero pathways and U.S. trade policy could mean for the value of Canadian crude.

R · Scenario analysis
Canadian Crude Prices and Trade Vulnerability
Role
Analysis and report
Stack
R, ggplot2, R Markdown
Data
Canada Energy Regulator Energy Futures 2023, Canadian International Merchandise Trade Database
Date
January 2025
Context

Why it mattered

Canadian crude sells at a discount to world benchmarks, and almost all of it goes to one customer. Two forces could reshape its value: the global shift to net zero, and trade policy in the United States.

This R report pairs the Canada Energy Regulator's Energy Futures 2023 price projections with monthly export values by trade route, and shows both risks in four charts with short takeaways.

The question
How exposed is the value of Canadian crude to net-zero pathways and to U.S. trade policy?
  • How do Western Canadian Select (WCS) prices compare with Brent and WTI?
  • How far apart are the scenarios by 2050?
  • How concentrated are exports on one route?
Approach

How I solved it

01 · Sources

Projections plus trade flows.

Scenario prices from the Canada Energy Regulator and monthly export values from the merchandise trade database.

CER Energy Futures 2023Merchandise trade databaseWCS, WTI and Brent pricesR projecttidy, then ggplot2
02 · Benchmarks

WCS trails the world.

Under the Global Net-zero scenario all three benchmarks fall after the 2022 spike, and WCS stays below Brent and WTI because of transport costs and crude quality.

$0$50$1002015202520352050BrentWTIWCSUS$ 2022 per barrel, Global Net-zero scenario
03 · Scenarios

Three futures for WCS.

Current Measures holds near $60 a barrel, Canada Net-zero eases to $45 by 2050, and Global Net-zero falls to about $12.

$0$40$802015202520352050Current measures $60Canada net-zero $45Global net-zero $12WCS, US$ 2022 per barrel
04 · Exports

One route carries the value.

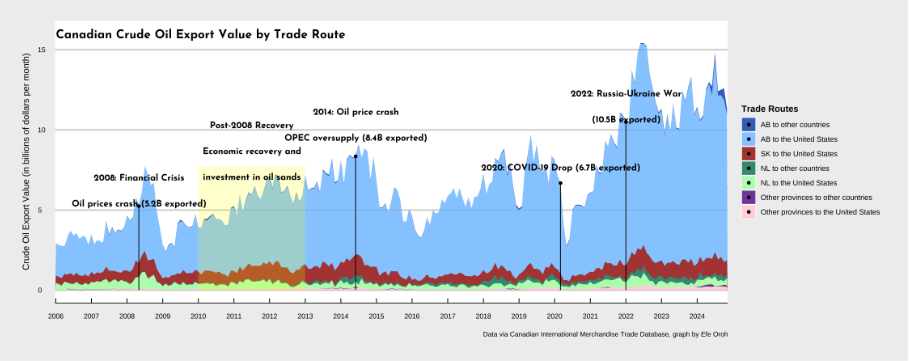
Monthly export value at key moments since 2008. Alberta to the United States dominates every year, so a tariff would land on most of the trade at once.

$0B$5B$10B2008crisis$5.2B2014price crash$8.4B2020COVID$6.7B2022war spike$10.5BExported in the month labelled, $ billions
05 · Takeaway

Concentration is the risk.

The report closes on diversification: new routes and markets reduce exposure to a single buyer's policy.

WCS 2050, GLOBAL NZabout $12WCS 2050, CURRENT$60MAIN BUYERUnited StatesRULESscenario spreadplus marketconcentrationGENERATED TEXTWithout greaterdiversification ofexport routes andmarkets, Canadianproducers remainvulnerable to policyshifts south of theborder.
Outcome

What it delivers

$45WCS by 2050 under Canada Net-zero, from $62 in 2025 (US$ 2022)
$12 vs $60WCS in 2050, Global Net-zero against Current Measures
$10.5Bexported in a single month during the 2022 price spike
1 buyerAlberta to the United States dominates export value
Demo

See it for yourself

The full report, with every chart and the written analysis.

Canadian Crude Prices and Trade Vulnerability preview