← All work

Pipeline Capacity and Royalty Revenue

Following Canadian crude from pipeline capacity to U.S. refineries to Alberta's royalty revenue.

R · Energy infrastructure
Pipeline Capacity and Royalty Revenue
Role
Analysis and report
Stack
R, API pulls, ggplot2, R Markdown
Data
Canada Energy Regulator pipeline throughput, U.S. EIA imports, Government of Alberta royalties
Date
March 2025
Context

Why it mattered

Alberta's oil is landlocked. What it earns depends on how much the pipelines can carry, where they go, and what buyers will pay. This report follows the barrels from the pipe to the provincial treasury.

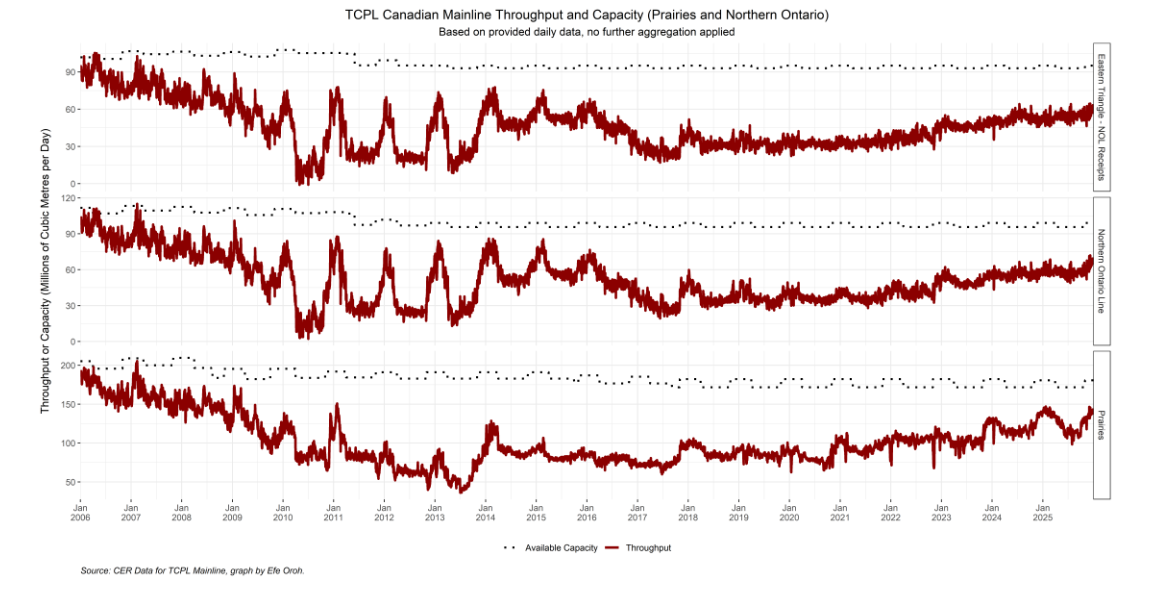
It combines Canada Energy Regulator throughput data for the Enbridge Mainline, Trans Mountain and the TCPL Mainline, U.S. Energy Information Administration import data by refining region, and Government of Alberta royalty records, all pulled and charted in R.

The question
How do pipeline capacity, dependence on U.S. buyers and royalty revenue fit together in Canada's oil economy?
  • Are the main export pipelines running full?
  • Did the Trans Mountain Expansion open new markets?
  • Where does Alberta's royalty revenue come from now?
Approach

How I solved it

01 · Sources

Three agencies, one workflow.

Pipeline throughput and capacity, U.S. crude imports by refining district, and a royalty series back to 1970.

CER pipeline throughputU.S. EIA crude importsAlberta royalty recordsR workflowAPI pulls, tidy,ggplot2
02 · Capacity

The main corridor runs close to full.

Enbridge Mainline shipments at Gretna have tracked just under available capacity for years, so new supply needs new pipe.

3004005002008201420202025capacityshipmentsThousand cubic metres per day, approximate
03 · New route

Trans Mountain finally reaches tidewater.

Sumas has carried about 200 thousand barrels a day into Washington State and Burnaby about 100. Westridge tanker exports were small until the expansion opened, then surged in 2024 and 2025.

Burnabyabout 100Sumasabout 200Westridgebefore TMXsmallWestridgeafter TMXsurgeThousand barrels per day, approximate
04 · Buyers

U.S. Midwest refineries run on Canadian heavy.

In the PADD 2 Midwest region, Canadian heavy crude supplies almost all imports, and it has been displacing other countries in other regions too.

PADD 1EastPADD 2MidwestPADD 3GulfPADD 4RockiesPADD 5WestCanadaRest of worldHeavy sour imports, thousand barrels per day, approximate
05 · Royalties

From gas to oil sands.

Natural gas royalties led through the 1990s and 2000s. Oil sands royalties overtook them in the 2010s and drove the 2022 surge.

$0B$10B$20B199520052022Natural gasConventional oilOil sandsOtherCAD billions, approximate, read from the report chart
Outcome

What it delivers

About 200thousand barrels a day to Washington State through Sumas
2024 to 2025Westridge tanker exports surge after the Trans Mountain Expansion
PADD 2U.S. Midwest refineries run largely on Canadian heavy crude
2010soil sands overtake natural gas as Alberta's main royalty source
Demo

See it for yourself

The full report, with every chart and the written analysis.

Pipeline Capacity and Royalty Revenue preview