← All work

Industry Profiles Automation

All 18 annual industry profiles rebuilt from Statistics Canada data in a single run.

Automation · R
Industry Profiles Automation
Role
Built the automation
Stack
R, Statistics Canada tables, Excel outputs
Data
Labour Force Survey, establishment size, business counts, wages
Scale
2M+ rows, 18 industries
Context

Why it mattered

Alberta publishes annual profiles of its major industries, from mining and oil and gas extraction to health care. Every profile carries the same tables: labour force characteristics, working conditions, employment by establishment size, business counts, gender, age and wages.

Building them meant querying Statistics Canada tables by hand for each of 18 industries and formatting dozens of Excel tables. It took about a month each cycle, and small inconsistencies crept in between profiles.

The question
Can all 18 industry profiles be refreshed for a new reporting year in a single run, with identical structure every time?
  • Which tables does each profile need, and from where?
  • How do we make every industry follow the same rules?
  • How do analysts get publication-ready files without copy and paste?
Approach

How I solved it

01 · Run

Pick a year, press run.

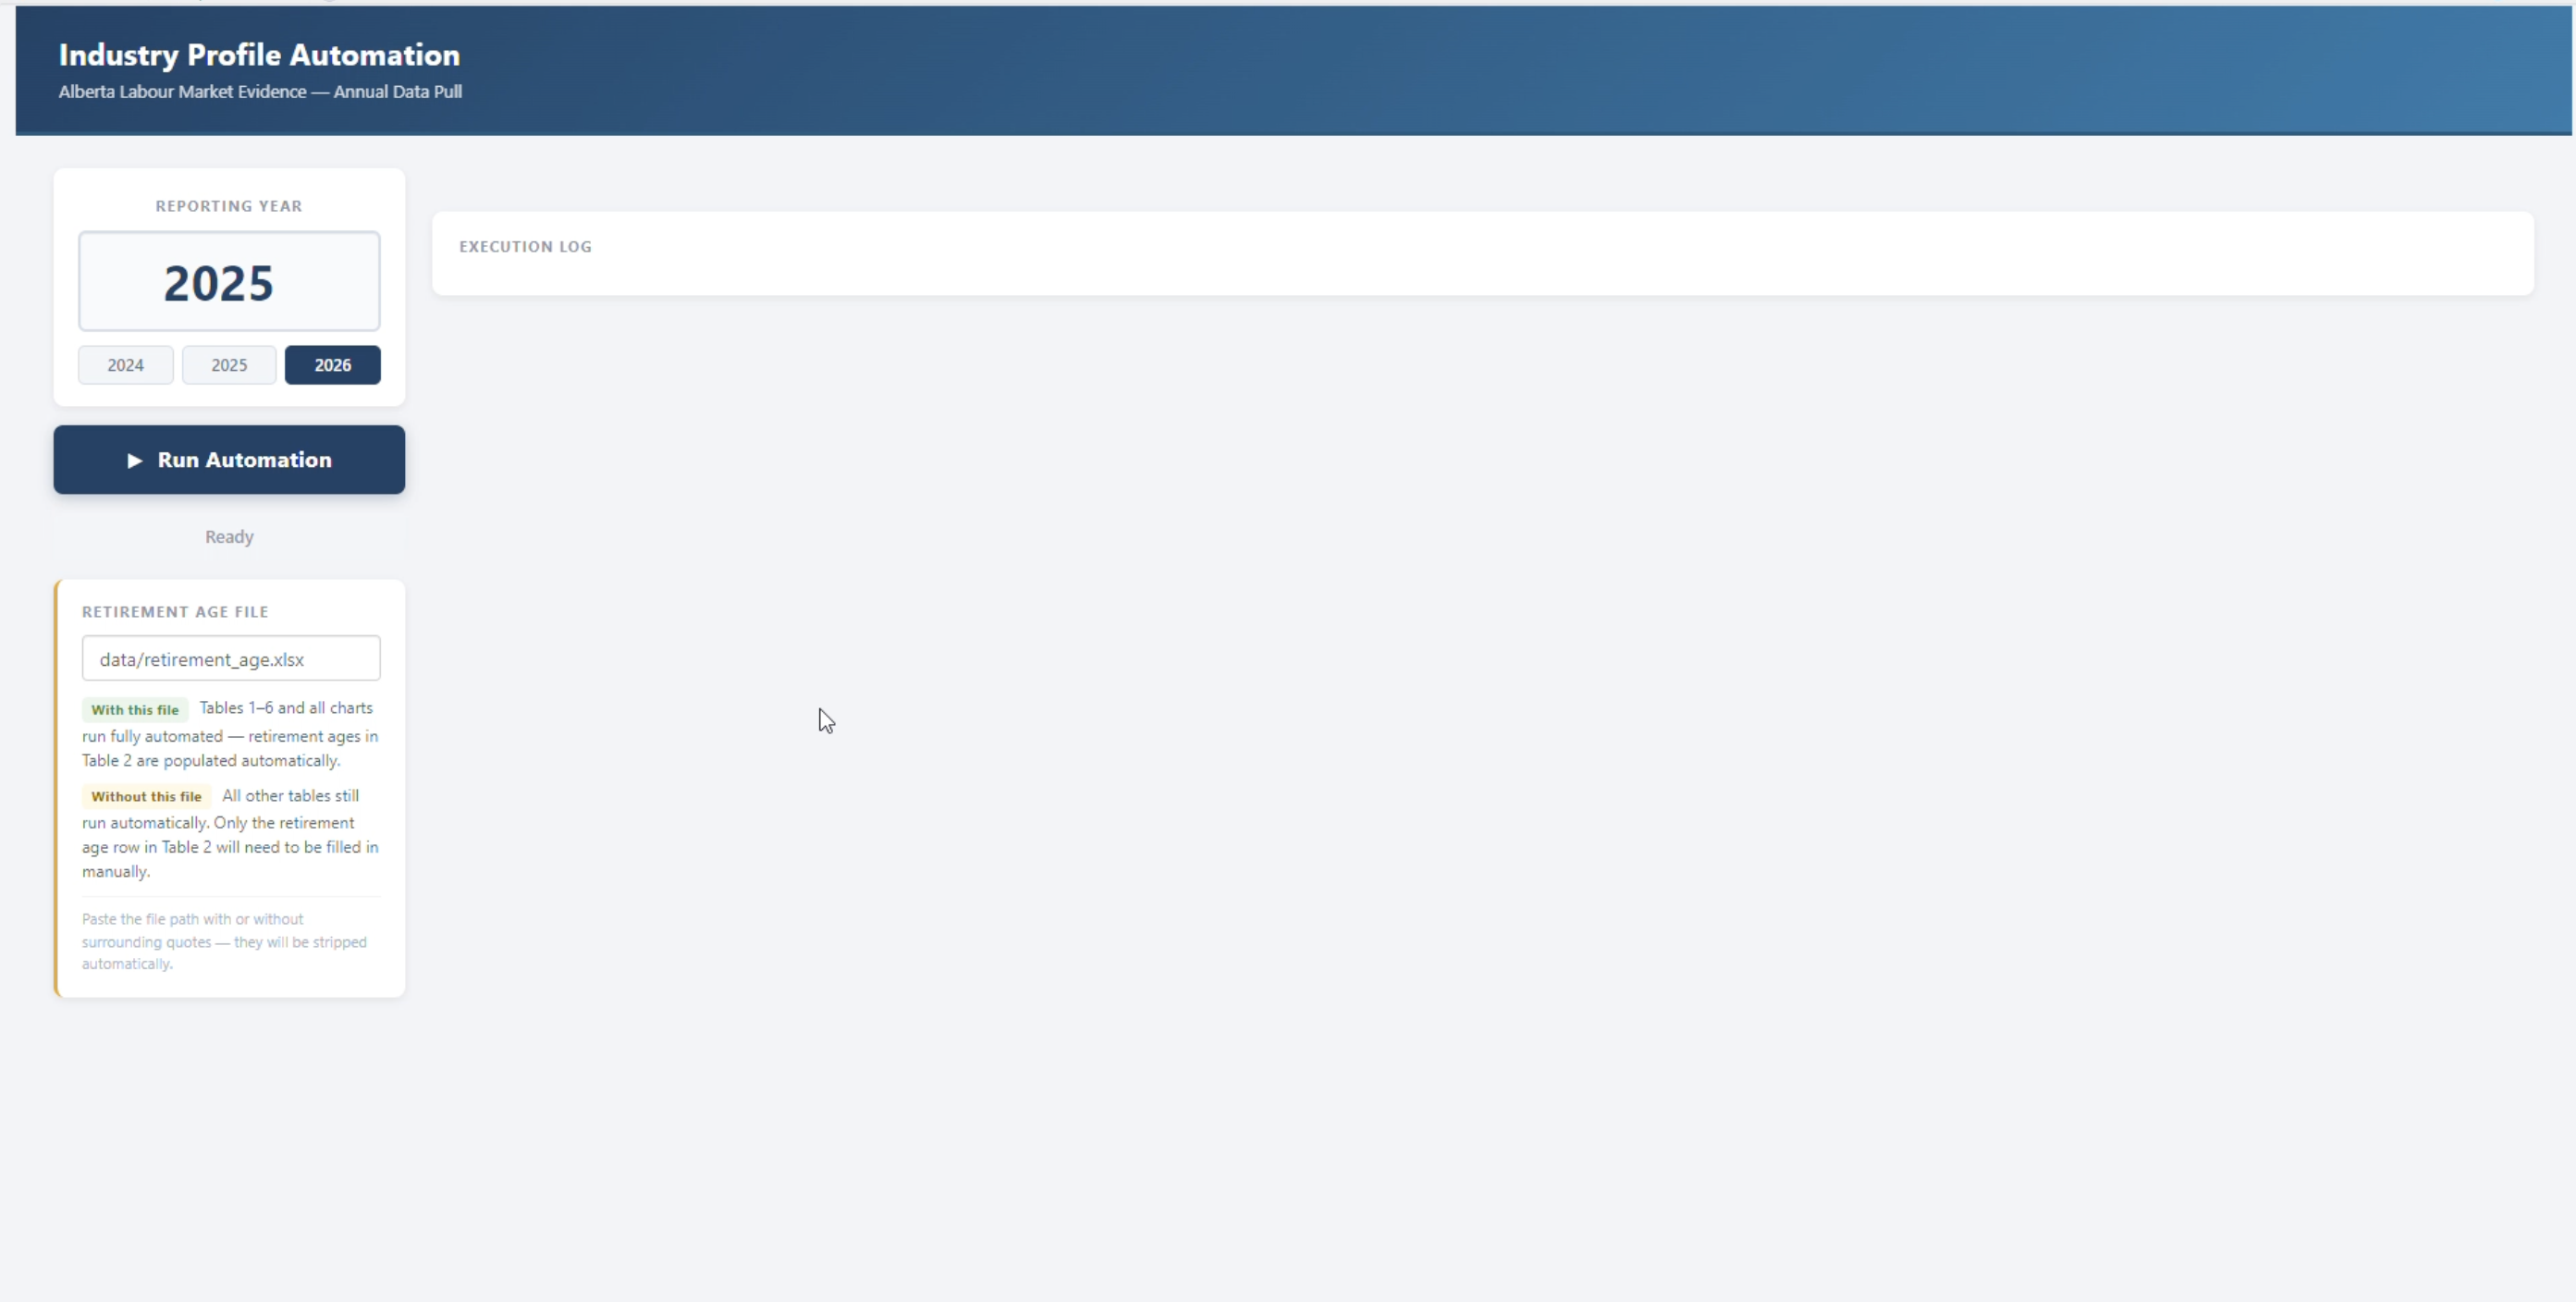
A small app takes the reporting year and runs the whole pipeline, ticking off each table as it is written.

Industry Profile AutomationREPORTING YEAR2025Run AutomationPull data from Statistics CanadaPre-process datasetsTable 1: Labour force characteristicsTable 2: Working conditionsTable 3: Employment by establishment sizeTable 4: Business countsTables 5 and 6: Gender and ageChart 1: Wage data
02 · Pull

Every source in one pass.

The pipeline requests each Statistics Canada table once for all industries, more than 2 million rows.

Labour Force SurveyEstablishment size dataBusiness Register countsWage dataRaw pulls2M+ rows
03 · Process

Same rules for every industry.

Filters, aggregations and shares are written once, so every profile is calculated the same way.

Filterindustry(NAICS)AggregateAlberta, byyearDeriveshares andchangesFormatpublicationstyle
04 · Loop

One template, 126 outputs.

The template runs for each of the 18 industries and writes all seven outputs for each one.

Profiletemplateone template18 industries × 7 outputs126 outputs per run
05 · Deliver

Ready for the profile document.

Excel files land in a folder, one per table, already in publication format.

Alberta Mining and oiland gas extractionindustry profile 2025Labour force characteristicsWorking conditionsSize of businessesHuman resources profileWagesAdditional information
Outcome

What it delivers

126outputs per run: 18 industries × 7 tables and charts
2M+rows processed
1 runinstead of about a month of manual work
95%+less time on each annual cycle
Demo

See it for yourself

A short screen recording of the finished work. It only plays when you press the button.

Industry Profiles Automation preview