← All work

Canada's Electricity Mix and Emissions

How Canada's power mix changed, what it did to emissions, and how Alberta's market sets the price of power.

R · Energy transition
Canada's Electricity Mix and Emissions
Role
Analysis and report
Stack
R, ggplot2, R Markdown
Data
National GHG Inventory 2025, ECCC projections, AESO merit order data
Date
March 2025
Context

Why it mattered

Canada's power sector has cut its emissions sharply while generating about the same amount of electricity. The story is in the mix: which fuels replaced coal, which provinces still emit the most, and how Alberta's market decides which plants run.

The report uses Canada's National Greenhouse Gas Inventory (2025), Environment and Climate Change Canada's reference case projections, and Alberta Electric System Operator offer data, all processed and charted in R.

The question
How has Canada's power mix changed, what has that done to emissions, and how does Alberta's market set the price of power?
  • What replaced coal in Alberta?
  • Which provinces drive electricity emissions, now and to 2040?
  • Why do prices spike when demand is high?
Approach

How I solved it

01 · Sources

Inventory, projections, market offers.

Generation and emissions history, the federal reference case, and hourly offers from Alberta's power pool.

National GHG Inventory 2025ECCC reference caseAESO merit order dataR pipelineclean, reshape,chart
02 · Mix

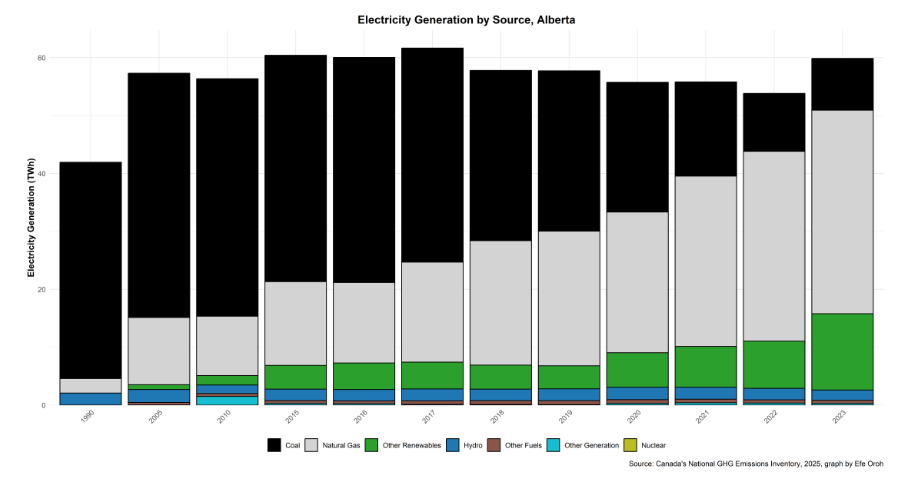
Alberta swapped coal for gas and wind.

Coal produced over 80% of Alberta's power in the early 1990s and roughly 15 to 20% by 2023, while total output stayed just under 60 TWh.

0%50%100%Early 1990s83%12%202317%58%22%CoalNatural gasRenewablesOtherAlberta, share of generation, approximate
03 · Emissions

Half the emissions, and falling.

National electricity emissions fell from just under 120 Mt in the mid-2000s to under 60 Mt by 2020, and the reference case projects about 10 to 15 Mt by the late 2030s.

0 Mt60 Mt120 Mt2005201520252040projectionhistoryreference case
04 · Provinces

A few provinces emit most of it.

Alberta accounts for about 40 to 45% of electricity emissions, Saskatchewan 20 to 25% and Ontario 15 to 20%. Hydro-heavy provinces contribute little.

0%25%50%Albertaabout 42%Saskatchewanabout 22%Ontarioabout 17%Rest of Canadaabout 19%Share of electricity emissions, approximate
05 · Merit order

Cheapest first; the last unit sets the price.

Offers are stacked from lowest to highest price. On 11 to 14 January 2024, demand sat on the steep end of the stack and the pool price climbed toward the $1,000 per MWh cap.

price ($/MWh)offered generation (GW)hourlydemandpool price set herewind, hydrocoalgaspeaking units
Outcome

What it delivers

About 50%fall in national electricity emissions, mid-2000s to 2020
10 to 15 Mtprojected by the late 2030s under the reference case
80%+ coalin Alberta's early 1990s generation, down to roughly 15 to 20% by 2023
About 10%of Canada's electricity is generated in Alberta
Demo

See it for yourself

The full report, with every chart and the written analysis.

Canada's Electricity Mix and Emissions preview