Energy Market Intelligence Dashboard
Four Statistics Canada energy indicators in one Power BI model, with a monthly executive summary written automatically for each province.
Power BI · API pipeline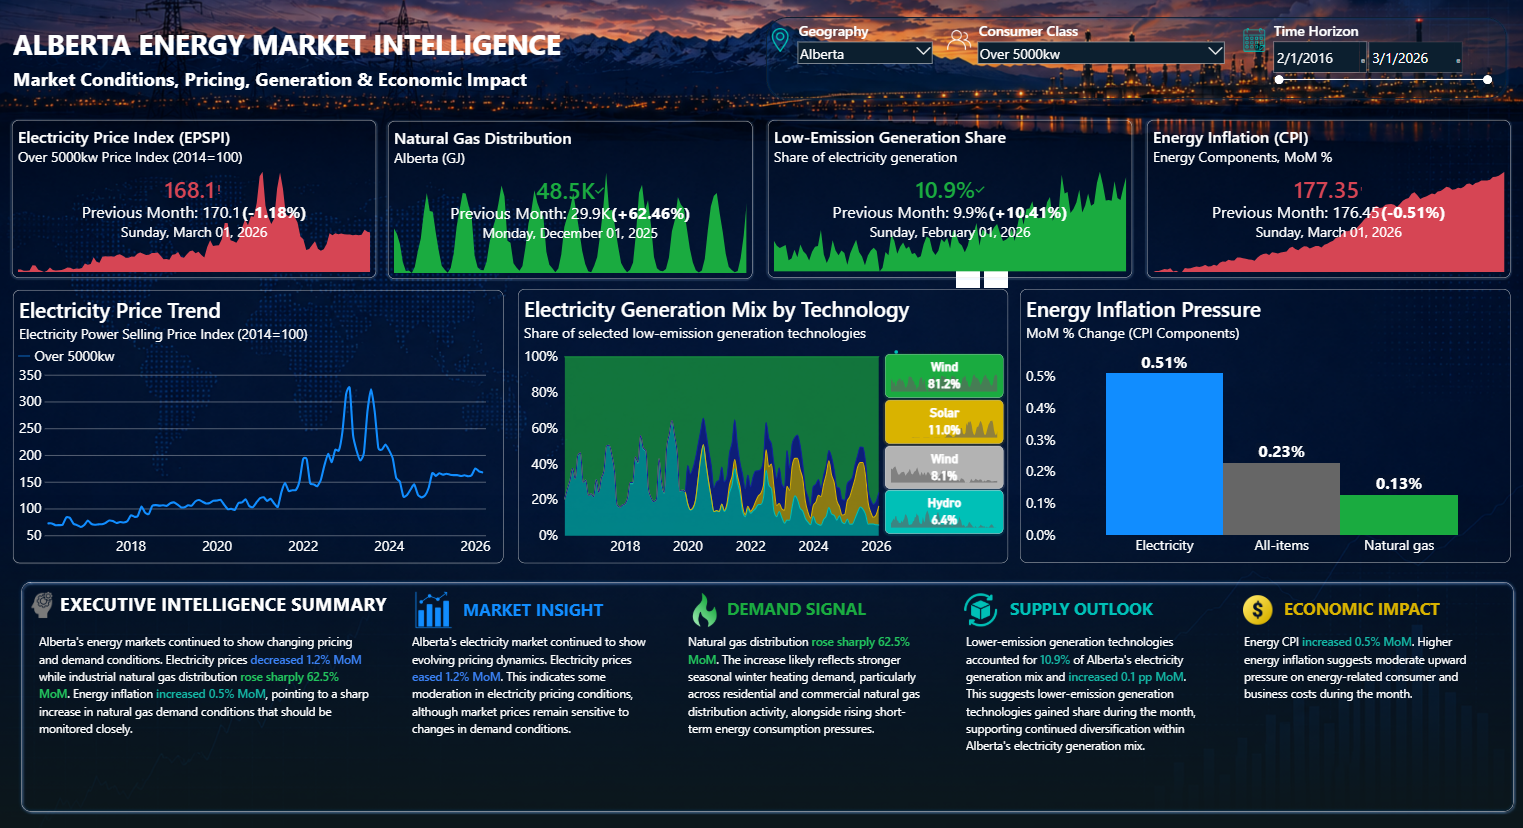
Why it mattered
Electricity prices, natural gas demand, the generation mix and energy inflation move together, but Statistics Canada publishes them as separate tables with different units and release timing. Reading them side by side for one province meant opening four tables and doing the arithmetic by hand.
This dashboard pulls all four through the Statistics Canada API into one model, switches between Canada and the provinces in a click, splits large and small electricity consumers, and writes a short executive summary of what changed this month.
For a chosen province and month, what changed in power prices, gas demand, low-emission supply and energy inflation, and what does it mean?
- Are electricity prices rising for large or small consumers?
- Is natural gas demand spiking, and why?
- Is low-emission generation gaining share?
What it delivers
See it for yourself
A short screen recording of the finished work. It only plays when you press the button.