← All work

Migration and Alberta's Participation Rate

How much Alberta's labour force participation depends on newcomers, estimated in R with counterfactuals, a decomposition and a structural break test.

R · Counterfactual modelling
Migration and Alberta's Participation Rate
Role
Analysis and report
Stack
R, tidyverse, strucchange, broom, R Markdown
Data
LFS, Statistics Canada 14-10-0083-01 and 98-10-0059-01, Alberta Treasury Board and Finance, 2021 Census
Period
2011 to 2024
Context

Why it mattered

Alberta's labour force participation rate, the share of people 15 and over who are working or looking for work, has trended down since 2014 to 2015. Over the same years the province drew large numbers of newcomers, both from other provinces and from abroad.

Participation drives labour supply, economic output and fiscal planning, so the policy question was direct: how much is migration holding the rate up, and how much of the decline is simply an older population?

I built the analysis in R from five public datasets and wrote it up as a reproducible R Markdown report, with every chart explained for a reader who has never run a regression.

The question
To what extent does Alberta's labour force participation depend on migration?
  • What would participation look like without each year's newcomers?
  • How much of the decline is ageing rather than behaviour?
  • Did COVID-19 leave a lasting mark, and does Alberta keep the people it attracts?
Approach

How I solved it

01 · Assemble

Five sources, one tidy panel.

The Labour Force Survey, immigrant labour force data (14-10-0083-01), interprovincial migration from Alberta Treasury Board and Finance, immigrant retention (98-10-0059-01) and 2021 Census mobility, joined by year, age group and migrant stream.

Labour Force SurveyImmigrant labour forceInterprovincial migrationImmigrant retention2021 Census mobilityTidy panel in Ryear × age group× migrant stream
02 · Counterfactual

Take the newcomers out and recompute.

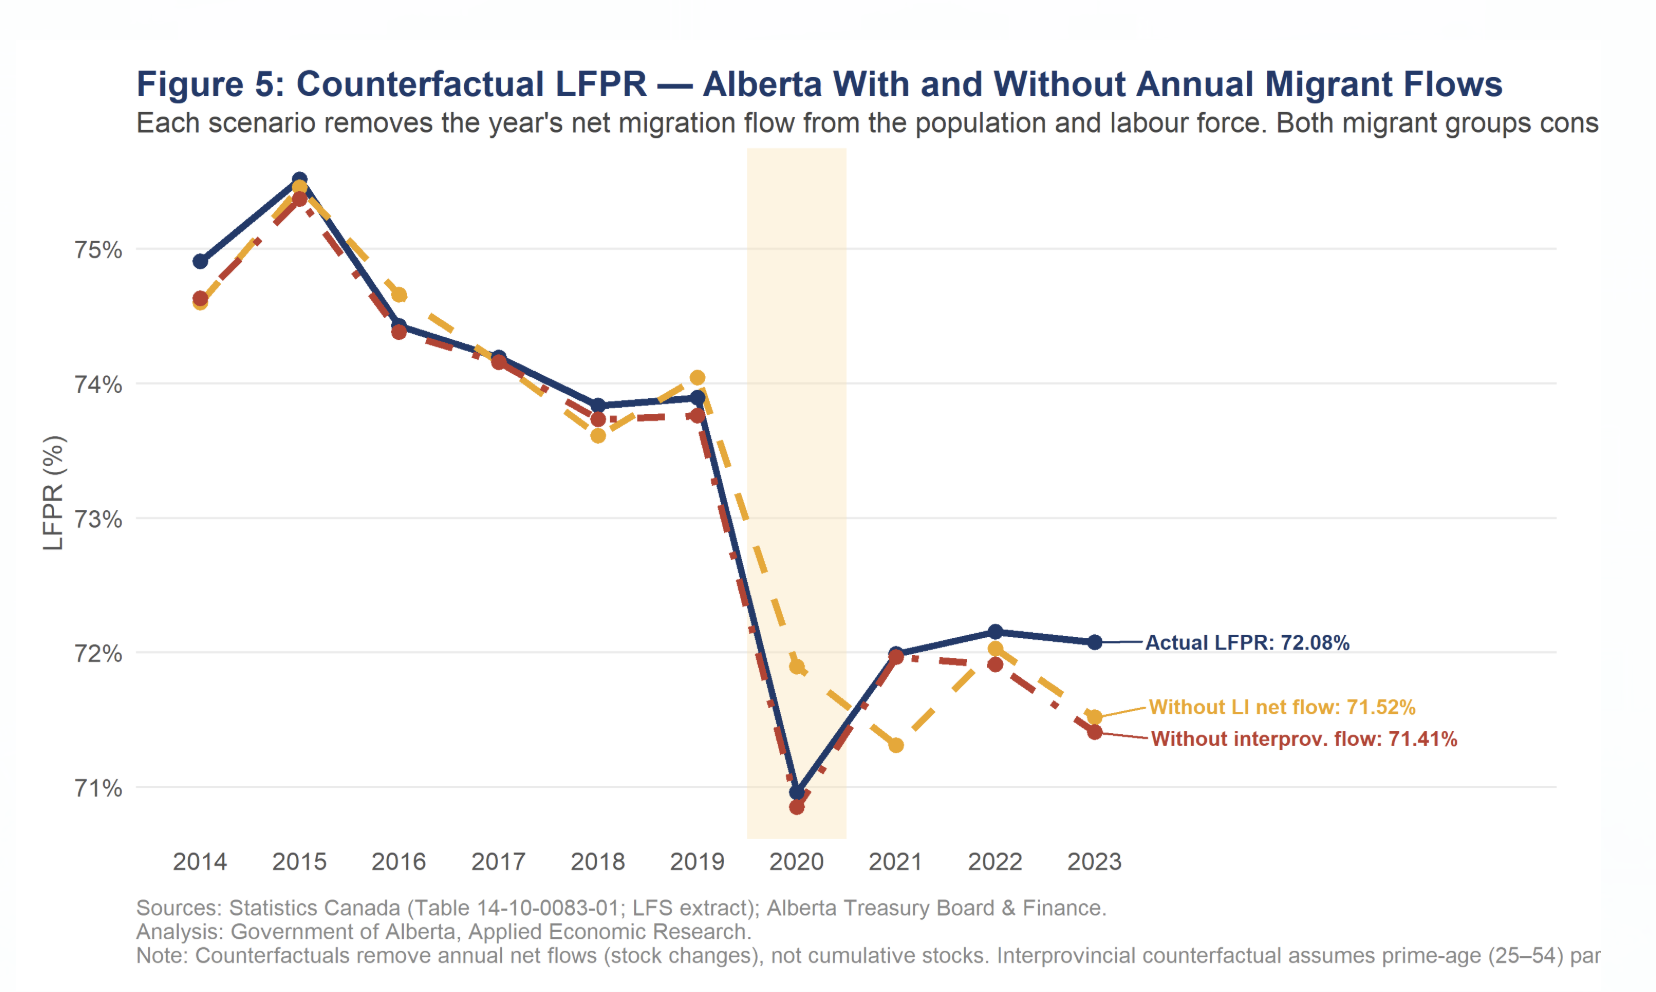
Each year's net inflow is removed from both the population and the labour force, and the rate is recalculated. The gap between actual and counterfactual is that group's contribution.

71%73%75%2014201720202023COVIDActual 72.08%No immigrant inflow 71.52%No interprovincial 71.41%
03 · Decompose

Separate ageing from behaviour.

A Kitagawa decomposition splits each year's change into a composition effect, a growing 55 and over population, and a rate effect, people in each age group participating more or less.

2012201420162018202020222024composition (ageing)rate (behaviour)Schematic. Ageing pulls the rate down in most years.
04 · Test

Check the association holds.

Regressions of participation on both migration flows, with the unemployment rate as a control. Both migration effects stay positive; the intervals are wide because the series is short.

no effectImmigrant inflowpositiveInterprovincial inflowpositiveUnemployment ratenegative
05 · Break

Did COVID-19 shift the level?

A Chow test at 2020 confirms that the post-COVID average sits measurably below the pre-COVID average, consistent with the pandemic speeding up the demographic shift.

71%73%75%2014201720202023break at 2020pre-2020 meanpost-2020 mean
06 · Retain

Does Alberta keep who it attracts?

Admission cohorts are followed one, three and five years after arrival. Retention falls in downturns, which shrinks the long-run workforce benefit of each cohort.

Cohortarrivesadmission yearYear 1still inAlberta?Year 3still inAlberta?Year 5falls indownturns
Outcome

What it delivers

0.2 to 1.0 ptsyearly lift to participation from landed immigrants, rising after 2019
72.08% vs 71.52%2023 participation, with and without that year's net immigrant inflow
0.1 to 0.2 ptsdrag per year from population ageing alone
30,000 to 35,000people behind each 1 point of participation
Demo

See it for yourself

The full report, with every chart and the written analysis.

Migration and Alberta's Participation Rate preview