← All work

Skilled Trades LMI Dashboard

Demand, supply, apprenticeships and a ten-year outlook for Alberta's 59 designated trades, mapped by economic region.

Power BI · Geospatial
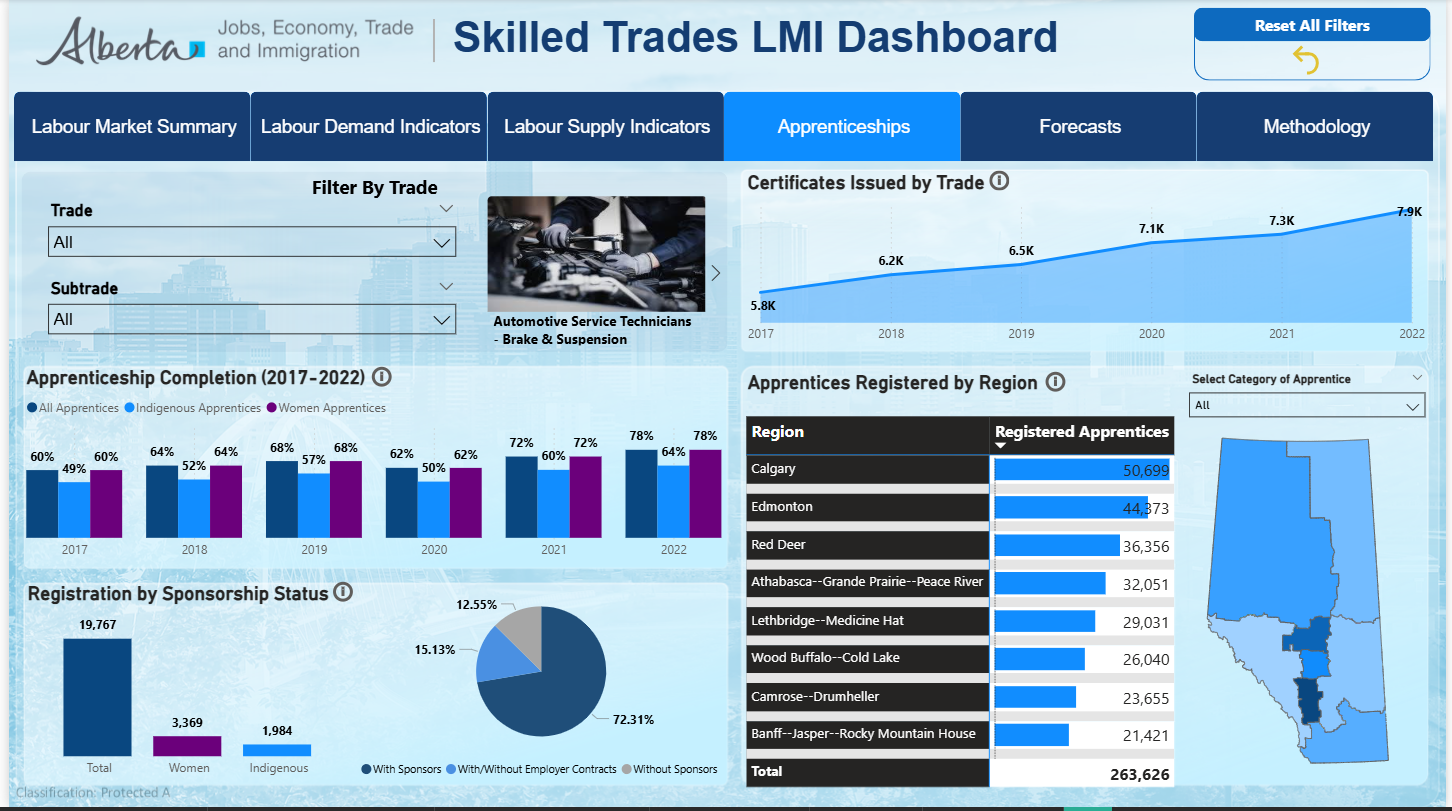
Skilled Trades LMI Dashboard
Role
Designed and built the dashboard
Stack
Power BI, DAX, R, GIS shapefiles
Data
LFS, Job Vacancy and Wage Survey, job postings, apprenticeship records, forecasts
Note
Proxy data where official figures were not yet available
Context

Why it mattered

Alberta has 59 designated trades, from electricians to crane operators. Decisions about training seats, apprenticeship funding and immigration depend on knowing which trades are short of workers and which have more workers than jobs.

The data does not make that easy. Labour market information is published by 5-digit National Occupational Classification (NOC) code, not by trade, and the indicators sit in separate surveys with different timing. Some trades share one code, and some codes have no 5-digit data at all.

The Skilled Trades LMI Dashboard brings demand, supply, apprenticeships and a ten-year forecast into one Power BI report, with a map of where the work is and a methodology page that documents every assumption.

The question
For each designated trade, is Alberta heading into a shortage or a surplus, and where in the province is the demand?
  • How many people work in the trade, and at what wage?
  • How many apprentices are registering and completing?
  • What do job openings versus job seekers look like from 2023 to 2033?
Approach

How I solved it

01 · Gather

Five sources, one trade model.

Employment and unemployment, vacancies and wages, online postings, apprenticeship records and a 2023 to 2033 forecast are combined into one model keyed by trade.

Labour Force SurveyVacancy and wage surveyOnline job postingsApprenticeship records2023 to 2033 forecastsTrade modelone row per trade,per indicator
02 · Map

Translate occupations into trades.

Each 5-digit NOC is mapped to one of the 59 designated trades. Electricians combine two codes (72200 and 72201), and trades that share a code are grouped so nobody is counted twice.

5-DIGIT NOCDESIGNATED TRADENOC 72410NOC 72310NOC 72200NOC 72201NOC 73100Automotive Service TechCarpenterElectricianConcrete Finisher
03 · Fill gaps

Fill the gaps, and say how.

Missing 5-digit values were estimated from higher-level NOC shares using the 2021 Census, vacancy gaps were interpolated, and quarterly wage survey data filled missing months. Each rule is written on the methodology page.

2018202020222024reportedestimatedSchematic.
04 · Locate

Put the demand on a map.

Alberta economic region shapefiles turn postings and apprentice registrations into a map, so a trade's demand can be read region by region.

CalgaryEdmontonRed DeerGrande PrairieFort McMurrayLethbridgeBubble size is illustrative.
05 · Forecast

Openings minus job seekers, to 2033.

Annual and cumulative imbalance for each trade. A negative balance means more openings than people to fill them, which the report labels a shortage.

2024202520262027202820292030Schematic. Below zero is a shortage.
06 · Serve

Six pages, one trade selector.

Summary, demand, supply, apprenticeships, forecasts and methodology. Pick a trade and every page, KPI and insight follows.

SummaryDemandSupplyApprenticesForecastsMethodLABOUR FORCEby tradeJOB VACANCIESby tradeBASE SALARYby tradeIMBALANCEShortageEXECUTIVE INSIGHTSelected skilled trades labourmarket is in shortage, with demandfor skilled trades workerssignificantly outpacing availablelabour supply.
Outcome

What it delivers

59designated trades, each selectable on every page
6report pages: summary, demand, supply, apprenticeships, forecasts, methodology
2033outlook horizon for openings against job seekers
Documentedevery mapping and estimation rule is on its own page
Demo

See it for yourself

A short screen recording of the finished work. It only plays when you press the button.

Skilled Trades LMI Dashboard preview